Pulse Code Modulation Decoding


Calculations & Observations


Fig.1 Showing a PCM-Encoding data (blue) of a Ground (green).


Fig.2 Showing Input (green) & output decoded (blue).


Fig.3 Frequency Spectrum of PCM-Decoding .


Fig.4 Power Spectrum of PCM Decoding.

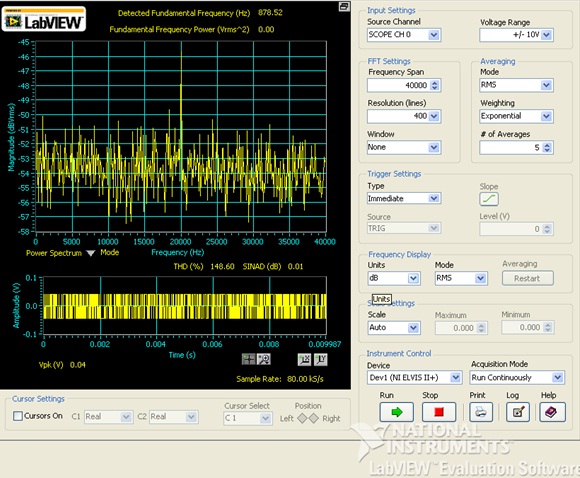
The THD is 148.60 % & SINAD is 0.01 dB. The Fundamental frequency component present is 878.52 Hz.


Fig.5 Frequency Spectrum of a PCM Encoding of a Ground.

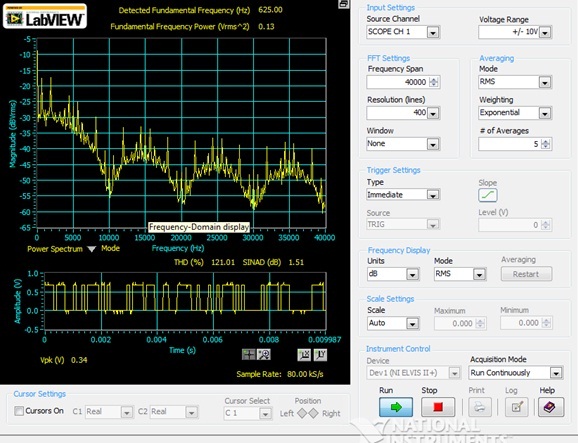
The THD is 145.87% & the SINAD is 0.81 dB. The fundamental frequency present is 609.70 Hz & the Fundamental Power is 0.14.


Fig.5 Power Spectrum of PCM Encoding of a data.

The THD observed is 121.01 % & SINAD is 1.51 dB.